


1. INTRODUCTION
2. MISSION DESIGN OVERVIEW
2.1. Mission Assumptions
2.2. ConOps
3. PHASE ANALYSIS
3.1. Phases 1-2: Launch, Deployment, and Plane Alignment
3.2. Phase 3: Phasing/Far-range Rendezvous
3.3. Phases 4-5: RPOD
3.4. Phases 6-7: Deorbit and Re-entry
3.5. Simulation Result and Its Feasibility
4. CONCLUSION
1. INTRODUCTION
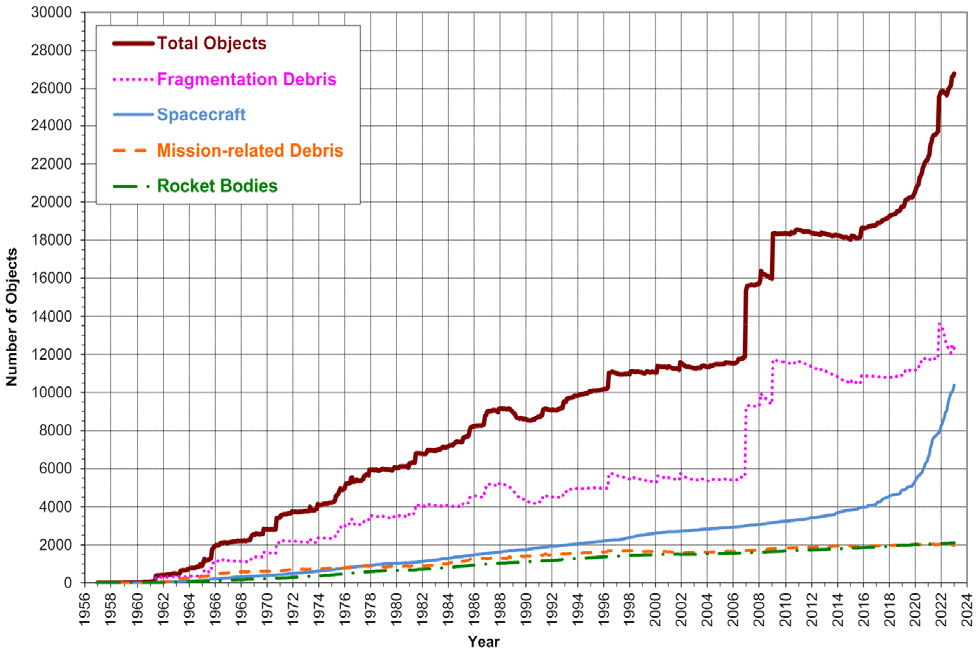
Over the past few years, the number of resident space objects in Earth’s orbit has increased dramatically, rising from roughly 20,000 in 2020 to nearly 28,000 by 2024, as shown in Fig. 1[1]. This sharp growth, fueled by the deployment of large satellite constellations and numerous small spacecraft, has intensified concerns about orbital congestion and potential collision hazards. A vivid illustration of these concerns occurred on February 5, 2025, when Chinese CZ-4 rocket debris and decommissioned COSMOS 2251 satellite debris approached within approximately 35 m of each other, underscoring the growing risk of catastrophic on-orbit collisions. Such incidents underscore the urgent need for on-orbit servicing (OOS) and active debris removal (ADR) missions to preserve the safety and operational efficiency of vital satellite constellations.
In prior work [2], we classified these missions as OOS and ADR missions according to whether their targets are cooperative or non-cooperative, and reviewed several recent major missions accordingly. Additionally, we investigated literature sources that categorize recent technical research trends and methodologies in OOS and ADR, identifying key technical hurdles and gaps in existing solutions.
Building on these insights, this study focuses on a conceptual ADR mission aimed at capturing debris and developing robust operational strategies. Specifically, we analyze each phase of the proposed concept of operations (ConOps), including rendezvous, proximity operation, docking or capture (RPOD), and subsequent deorbiting. Navigation and path-planning algorithms play a critical role in these phases, as they must account for uncertainties in orbital dynamics and object tracking. Furthermore, we perform a conjunction assessment during the deorbit phase to quantify additional risks posed by other resident space objects, thereby determining the probability of collisions and the necessity for avoidance maneuvers.
This paper proposes a comprehensive ConOps architecture for establishing baseline parameters in ADR mission design, details specific methods for each operational segment, and validates these methods through computational simulations using NASA’s General Mission Analysis Tool (GMAT) and MATLAB. The present study extends previous investigations [2,3] by refining the ConOps, capture mechanism of the robotic arm, and conjunction assessment during deorbit, thereby enhancing the overall ADR mission design. By demonstrating how a conceptual ADR architecture can be designed and tested, the results of this work aim to guide future endeavors in addressing the pressing challenges of debris mitigation and sustainable space operations.
2. MISSION DESIGN OVERVIEW
2.1. Mission Assumptions
The conceptual framework of this ADR mission rests upon three fundamental assumptions. First, the satellite acting as the Chaser (the ADR Satellite) is assumed to have a dry mass of 150 kg and carry 150 kg of propellant, yielding a total mass of approximately 300 kg. The propellant is assumed to have a specific impulse of 250 s and a thrust of 20 N.
Second, the target for the ADR mission is selected to be KOMPSAT-1, Korea’s first multipurpose practical satellite. As summarized in Table 1, KOMPSAT-1 was launched into a Sun-synchronous orbit (SSO) in 1999, has a dry mass of about 460 kg, and concluded its mission in December 2008. According to the two-line element set (TLE) data shown in Table 2, KOMPSAT-1 continues to orbit at a semi-major altitude of around 650 km. Based on these parameters, an approach strategy for the target is analyzed to determine the initial orbital conditions.
TABLE 1.
KOMPSAT-1 specifications
TABLE 2.
KOMPSAT-1 TLE data (05/29/2024 UTC)
Third, the mission requires non-cooperative rendezvous operations and is constrained by a short mission duration. Specifically, it must be completed within three months.
2.2. ConOps
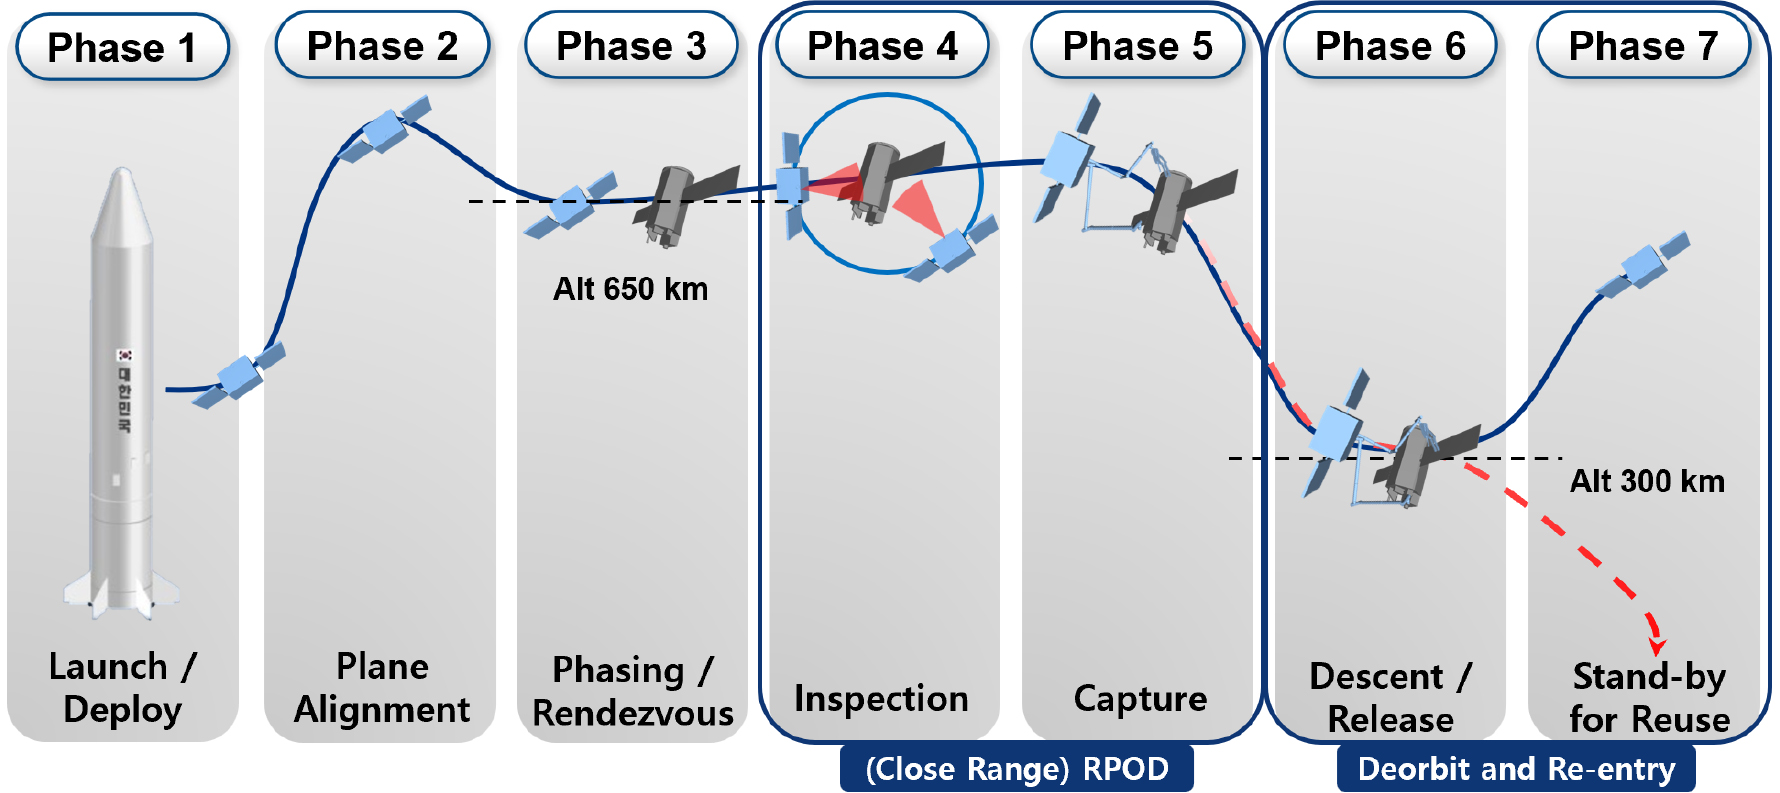
The proposed ADR mission comprises seven phases, as shown in Fig. 2. Proximity operations and capture are conducted at an altitude of approximately 650 km, followed by release at around 300 km to initiate deorbit and re-entry. For each phase, we performed detailed design and analysis using GMAT and MATLAB.
3. PHASE ANALYSIS
3.1. Phases 1-2: Launch, Deployment, and Plane Alignment
Rendezvous and capture (docking) missions require alignment between the target’s orbital plane and the chaser’s orbital plane. The approach scenario, following initial launch and deployment, is determined by the chosen plane alignment method. This study assumes that aligning the inclination at launch does not pose significant constraints, given that the target is in an SSO and considering South Korea’s geopolitical requirements. Consequently, matching the orbital plane difference caused by Right Ascension of Ascending Node (RAAN) becomes the key consideration.
3.1.1. Scenario 1.
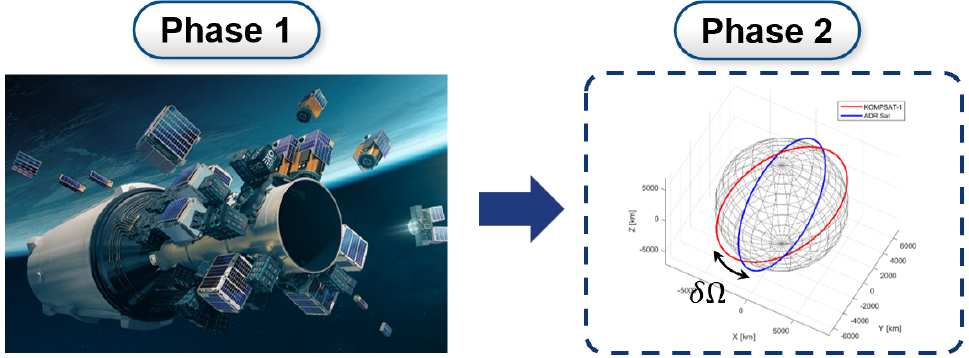
When launching multiple payloads on a single launch vehicle, such as the KSLV-II, in a ride-share configuration, the chaser cannot be deployed directly into the required orbital plane, as shown in Fig. 3. To align the RAAN, two different maneuver strategies can be employed.
The first method is a passive approach using perturbation effects. This method utilizes the effect, which is modeled by Eq. (1) as in [5].
where 𝛺 is RAAN, is the second zonal harmonic constant of Earth’s gravitational potential, is the radius of the Earth, is the semi-major axis (SMA), is the eccentricity (ECC), is the standard gravitational parameter of Earth, and is the inclination (INC).
By appropriately designing the chaser’s SMA () and ECC (), it becomes possible to create a difference between the chaser’s RAAN rate of change and the SSO’s RAAN rate of change of 0.98 °/day, as shown in Eq. (2). Over time, this difference allows the RAAN values to align.
Taking KSLV-II into account and assuming a local time at the descending node (LTDN) 13:30 launch on the reference date in Table 3, simulations showed that with an initial RAAN difference of approximately -25°, setting the orbit to a perigee altitude of 500 km and an apogee altitude of 3000 km resulted in a required alignment duration of 729.1 days [2], as shown in Fig. 4 and Fig. 5. Although this method offers the distinct advantage of minimal propellant expenditure when compensating for disparate orbital geometries, it necessitates substantial temporal investment—depending on the angular separation between the two planes—rendering it unsuitable for time-constrained missions. Moreover, relying on prolonged natural orbital motion elevates the risk of collision with other active satellites or space objects and amplifies operational uncertainty stemming from myriad perturbative factors over extended durations.
TABLE 3.
Initial orbit conditions for the scenario 1
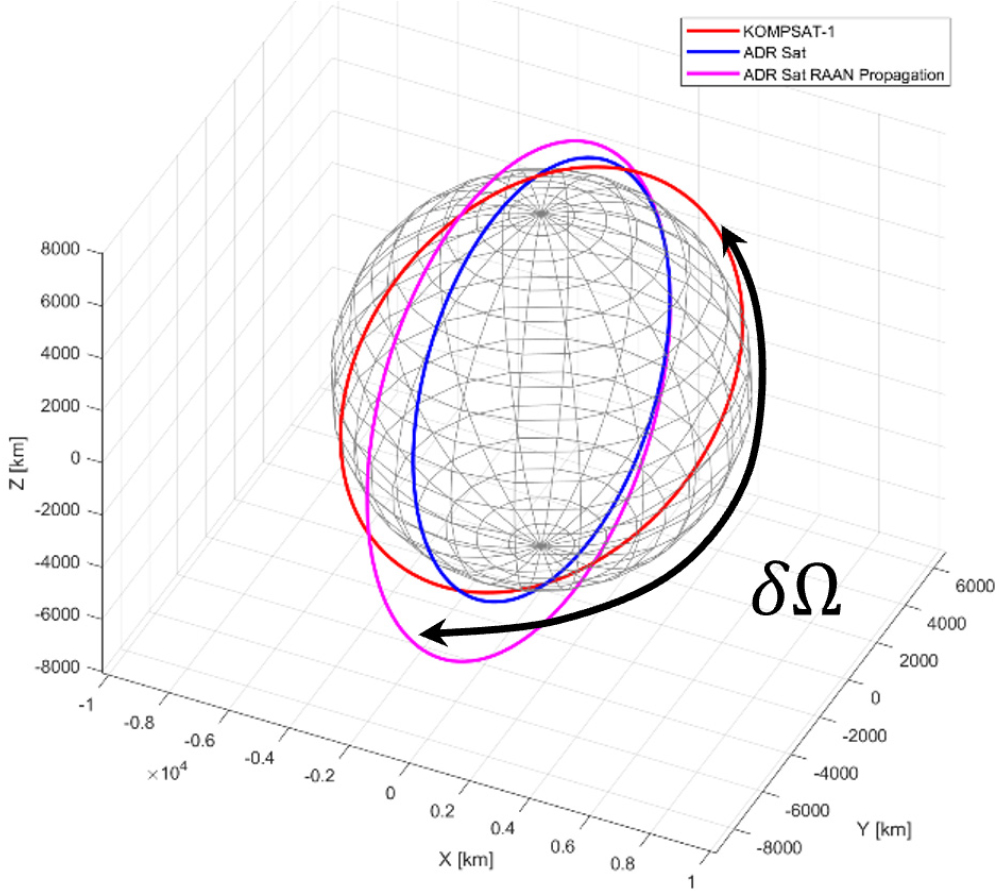
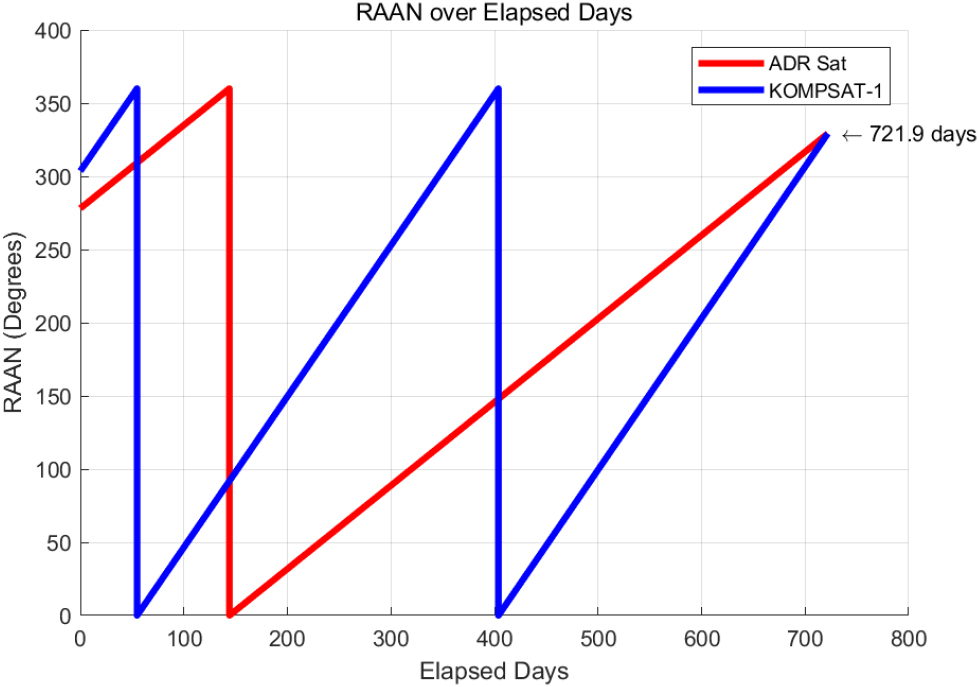
The second method is an active approach using thrust [2,6]. To rapidly align two different orbital planes, one can perform an orbital plane transfer at the common point along the line of intersection between the reference plane and the target plane, using an ideal impulsive burn. Let 𝛿 be the angle between the two orbital planes that share the same apse line; the required for this plane transfer is given by Eq. (3):
In this scenario, a -25° orbital plane difference would require approximately 3.3 km/s of , with GMAT simulations indicating an actual consumption of about 3.4 km/s. Since this level of delta-v exceeds the capability of a single ADR satellite, the approach is infeasible.
3.1.2. Scenario 2.
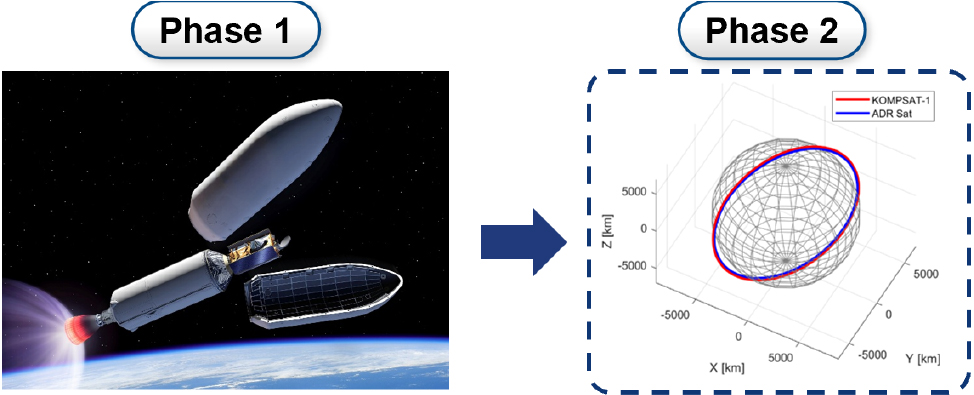
This methodology entails employing a customized single-launch service, such as a commercial or military-purpose launch vehicle, to directly reach and deploy into the target orbital plane, as illustrated in Fig. 6. Although this method is straightforward and convenient, it incurs substantial financial expenditure. Since Scenario 1 either fails to satisfy the ADR mission’s time constraints or demands an unachievable , this ADR mission design adopts Scenario 2, allowing for about a 1% error in inclination and RAAN upon deployment for further analysis.
3.2. Phase 3: Phasing/Far-range Rendezvous
Once the phase angle between the chaser and the target is reduced through phasing, the chaser must proceed to closer proximity for subsequent operations. If an inspection phase is considered, which may involve relatively long-term operations, the Relative Orbital Elements (ROE) framework is employed. This framework models the relative dynamics between two spacecraft and proves particularly advantageous for describing the chaser’s motion relative to the target using Keplerian elements while also accounting for orbital perturbations during extended inspection or rendezvous operations at separations ranging from a few kilometers to several tens of kilometers. Moreover, when the orbital planes of the target and chaser are nearly aligned, the ROE framework linearizes the relative orbit in terms of the relative semi-major axis, eccentricity, inclination, and mean argument of latitude, facilitating both the initiation and maintenance of the inspection phase. The dimensionless ROE state vector is defined based on the Keplerian elements of both the chaser and the target as follows Eq. (4)[8].
where is the Keplerian nonsingular elements, , are the components of the eccentricity vector, is the mean argument of latitude, is mean anomaly, 𝜔 is the argument of periapsis (AOP), and the subscripts and represent the chaser and target spacecraft, respectively. The symbol ∆ denotes the difference between the quantities of the two spacecraft.
3.3. Phases 4-5: RPOD
3.3.1. Close Range Navigation
Given the increasing emphasis on satellite docking and orbital object retrieval, the precise estimation of a target’s relative position and orientation has become paramount. Consequently, onboard sensor performance serves as a pivotal factor in determining mission success. Among available sensor methods, cameras and Light Detection and Ranging (LiDAR) stand out for their distinct strengths and limitations [9]. While LiDAR provides highly accurate distance measurements and precise three-dimensional coordinates, its performance degrades over extended ranges, reducing the fidelity of object details [10]. Conversely, cameras offer high-resolution visual data advantageous for long-range detection and initial recognition, but lack distance-measuring capabilities. To address this limitation, angles-only navigation techniques integrate orbital dynamics for distance estimation [11]. In practice, the complementary use of cameras for broad-range monitoring and LiDAR for close-proximity tasks can substantially enhance mission reliability [12]. Consequently, the present study focuses on leveraging LiDAR-derived point cloud data to refine pose estimation during critical near-field operations.
Point cloud data comprise discrete points distributed throughout three-dimensional space, each representing both the surface position and depth of an object [9]. These data are commonly produced by sensors such as LiDAR Time-of-Flight (ToF) sensors, stereo cameras, and depth cameras. LiDAR employs laser pulses to measure precise distances to an object’s surface, thereby providing accurate three-dimensional shape information [13]. ToF sensors measure the temporal interval required for reflected light to return, enabling real-time depth calculations that prove particularly efficacious at proximate ranges. Depth cameras frequently rely on stereo vision or infrared patterns to estimate an object’s three-dimensional distance. Because these sensors can supply both imagery and distance data simultaneously, the three-dimensional position of a target can be captured as a set of points.
Point cloud data furnish comprehensive spatial information and can thus be effectively employed in various space operations, including satellite docking, orbital debris capture, and robotic arm control. However, processing such data presents numerous computational challenges, most notably the registration of two distinct point sets, which requires determining the rotation and translation that relate one set to the other [14]. The computational cost of registration escalates dramatically with the size and complexity of the point sets. For instance, when comparing two sets of points, the complexity of finding point correspondences grows on the order of . A well-known registration algorithm, Iterative Closest Point (ICP) [15], repeatedly calculates the transformation that minimizes the distance between the two point sets, incurring substantial computational overhead in each iteration due to distance calculations and correspondence matching. Furthermore, point cloud data frequently exhibit incompleteness or partial occlusion, which complicates the derivation of accurate rotation and translation estimates. Consequently, existing registration methods can yield significant errors when only incomplete data are available, complicating the task of deriving the precise three-dimensional transformation for an entire object.
3.3.2. Cuboid Object Recognition via Polynomial Fitting
3.3.2.1. Object Shape Modeling Using Even-Degree Polynomials
To facilitate the recognition and classification of diverse cuboid or cuboid-like objects prevalent in space environments, this work employs polynomials comprising exclusively even-degree terms to model each object’s shape. For instance, simple quadratic surfaces such as spheres or ellipsoids can be modeled with second-degree polynomials, while more complex geometric structures like cuboids necessitate representation through fourth-degree polynomials.
During the polynomial fitting process, objects are distinguished according to their unique polynomial coefficients. This approach enables multiple objects within the same point cloud to be identified separately. For example, components that differ in both shape and size, such as a satellite body and its solar panels, are each fitted independently using separate polynomial models, which facilitates their unambiguous discrimination.
This methodology demonstrates considerable efficacy in differentiating heterogeneous objects within complex point clouds encompassing diverse structural configurations.
3.3.2.2. Object Parameter Estimation via Linear Regression
To accurately estimate each modeled object’s shape, size, and orientation from point cloud data, this approach initiates by computing all polynomial terms whose total exponent sum equals four. These homogeneous terms form the basis for linear regression, which is then used to fit the polynomial coefficients to each data point. Through this process, the overall shape of the object is captured, and its attitude is extracted by deriving a rotation matrix from the fitted homogeneous coefficients. Consequently, different point sets can be aligned with high accuracy, ensuring precise rotational alignment of the target object.
Subsequently, to account for positional changes, non-homogeneous terms are introduced. By analyzing these additional coefficients, the method directly estimates the object’s center coordinates and translational offsets, enabling robust performance even when the object undergoes spatial displacement. The integration of both homogeneous and non-homogeneous terms thus facilitates accurate reconstruction and alignment in scenarios involving combined rotation and translation, maintaining high precision in the final estimated parameters.
3.3.2.3. Polynomial Fitting on a Satellite Point Cloud Data
To validate the efficacy of the proposed polynomial fitting methodology, this work employed a point cloud dataset derived from a CAD model that closely replicates the KOMPSAT-1 satellite configuration. The satellite’s design incorporates a hexagonal cylindrical main body, two solar panels extending laterally, and several auxiliary components.
Both the main body and the solar panels retained their distinct shapes and spatial locations within the extracted point cloud. Notably, even when a panel was tilted or separated from the main body, incorporating rotational and translational transformations allowed the system to accurately determine its orientation. These results confirm that the KOMPSAT-1 satellite’s components can be reliably identified and aligned in three-dimensional space, demonstrating the method’s robustness for on-orbit applications requiring precise attitude and distance estimation.
3.3.3. Inspection
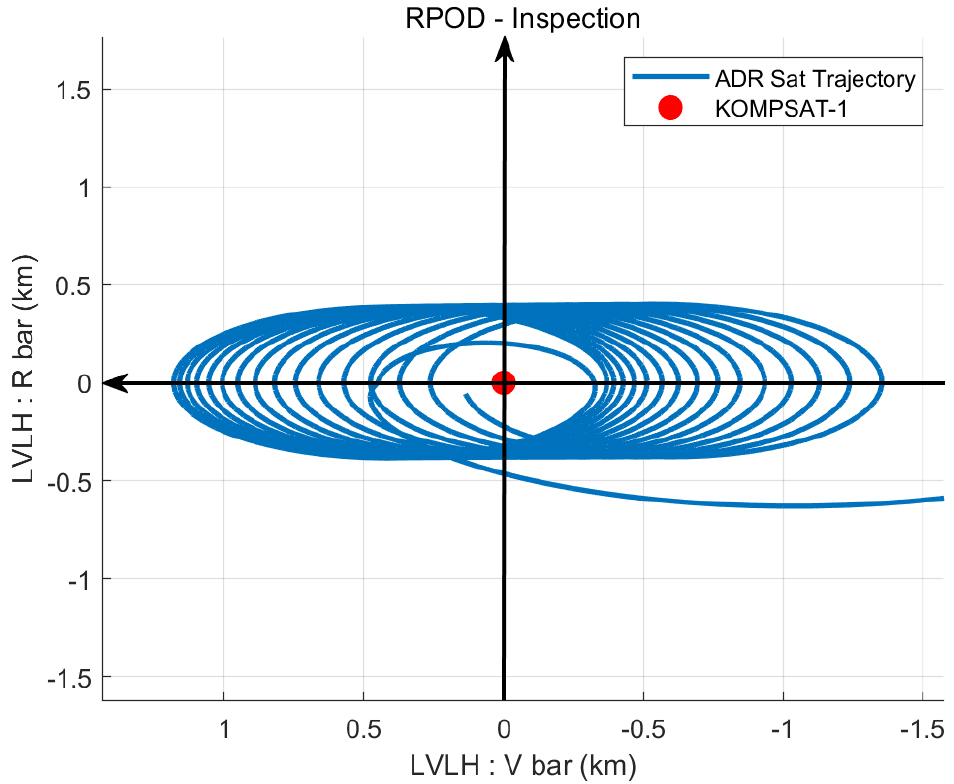
Inspection entails systematic observation of the target while maintaining orbital trajectories outside the KOZ, using sensors such as LiDAR and cameras to identify and assess the target’s status. By applying the ROE framework and setting the chaser’s relative semi-major axis and inclination with respect to the target to zero, the relative dynamics are linearized as Eq. (5), (6), enabling the chaser to orbit around the target for inspection.
where u is the vector of the control accelerations, and is the mean motion of the target spacecraft.
The solution to the linear dynamics of Eq. (6) can be represented using the State Transition Matrix (STM) as shown in equations Eq. (7) and (8)[16]:
Fig. 7 presents the results from the GMAT simulation.
3.3.4. Proximity Operation and Collision Avoidance Path Planning Algorithm
3.3.4.1. Collision Avoidance Path Planning Algorithm Survey
Approaching non-cooperative targets in space presents significant technical challenges caused by their unpredictable behavior and irregular geometries—such as collision-generated debris or expended rocket upper stages. Their unpredictable kinematic patterns significantly complicate the approach process, and as orbital environments experience increasing congestion, advanced obstacle- avoidance and path planning algorithms for active satellites become increasingly essential.
To address these challenges, spacecraft designed for rendezvous or proximity operations are equipped with onboard sensors such as cameras, LiDAR, or low-power radars to enable autonomous navigation. For instance, ESA’s ATV and Boeing’s Starliner have successfully implemented such sensors during ISS docking missions. Moreover, active spacecraft for missions like ADR and OOS, exemplified by AstroScale’s ADRAS-J mission, have demonstrated effective onboard navigation by capturing imagery of non-cooperative targets [17].
While autonomous path planning for satellites shares resembles ground-based robotics, the constraints of limited memory and computing power in space require specialized solutions. Recent studies have focused on designing proximity operation strategies that consider the satellite’s shape, the Keep-Out Zones (KOZ) induced by rotational dynamics, and safety approach corridors to ensure secure navigation.
Recent research demonstrates that numerical optimization methods are widely employed to solve the path planning problem for active satellites by modeling obstacles and approach corridors [18,19,20,21]. However, current obstacle modeling techniques have been criticized for their limitations in accurately representing satellites of various shapes—a shortcoming that must be addressed for developing general path planning algorithms.
Optimization-based approaches are favored not only for optimizing fuel consumption but also for effectively incorporating various constraints. Nonetheless, when obstacle avoidance or safety corridors are considered, the resulting path planning problems become nonconvex (as illustrated in Fig. 8), which engenders fundamental computational challenges. Unlike convex optimization, nonconvex constraints do not guarantee convergence to a global optimum and tend to be computationally intensive. To mitigate these issues, two main methodologies that approximate nonconvex problems as convex constraints have been widely employed as depicted in Fig. 9.
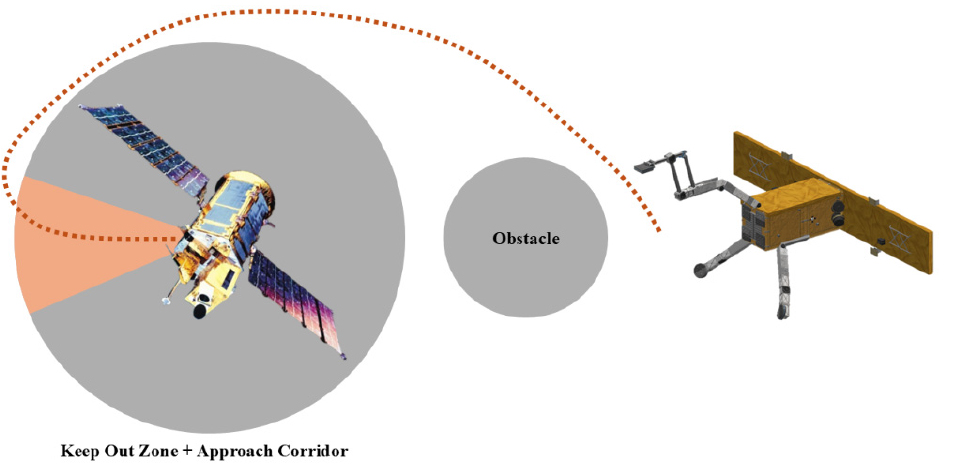
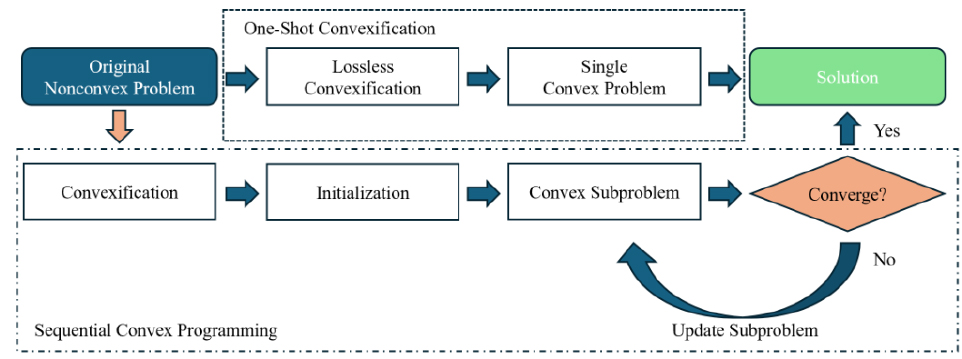
The first methodology constitutes a sequential approach, wherein a nonconvex problem is decomposed into several convex subproblems that are solved iteratively. At each stage, a partial optimal solution is obtained and utilized to formulate the next stage, gradually converging toward the overall optimum. The second methodology directly transforms a nonconvex problem into a convex problem, approximating it as a single convex optimization problem. By analyzing the inherent mathematical structure of the problem and appropriately converting its nonconvex elements, this approach facilitates more computationally efficient optimization procedures.
As summarized in Table 4, numerical convex optimization methods that handle nonconvex constraints often require iterative or approximate procedures, which may limit optimization performance, increase computational costs, or even prevent convergence to an optimal solution. Specifically, techniques like Sequential Convex Programming (SCP) require progressive relaxation or approximation of constraints, resulting in potentially unstable outcomes, difficulty in obtaining analytical solutions, and substantial dependence upon initial estimates.
TABLE 4.
Comparison of path planning methodology
To address these issues, this work employs a machine learning-based and sampling-based path optimization algorithm [3]. The proposed method incorporates constraints estimated from the satellite’s shape, a spherical KOZ resulting from rotations, and an approach corridor constraint. These elements are applied to a realistic satellite approach scenario, and the algorithm’s performance is validated through simulation.
3.3.4.2. Application on Rendezvous and Proximity Operation for Capturing KOMPSAT-1
In the Rendezvous and RPOD phase, Phases 4 and 5 of the ADR mission ConOps, an RNN-based sampling path planning optimization algorithm was applied. The feasibility of its real-world implementation and the reliability of the algorithm were evaluated using the Monte Carlo method.
The scenario assumed proximity operations within 100 m in a circular LEO orbit at 650 km altitude, and the dynamics were modeled using the Clohessy-Wiltshire equations as expressed in Eq. (9).
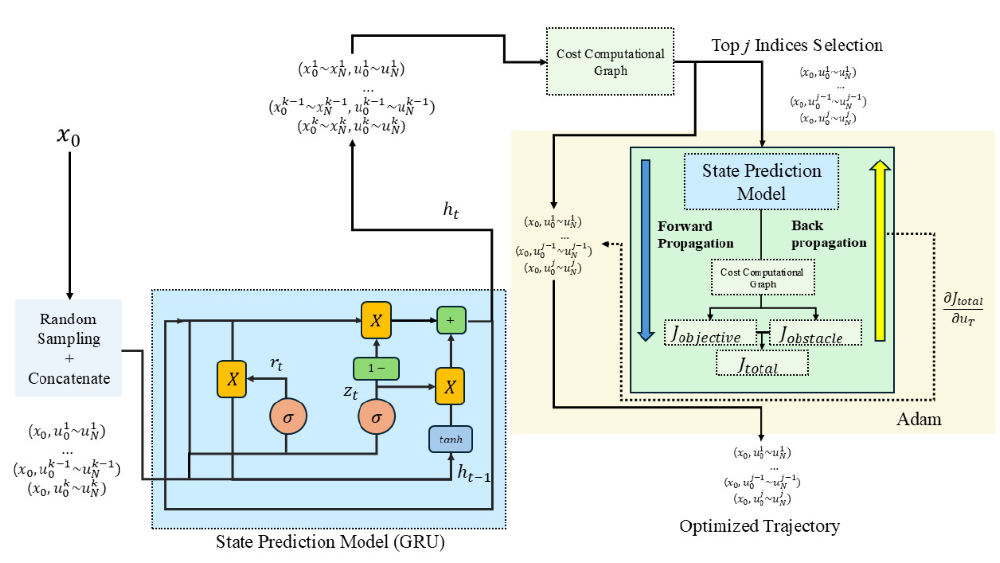
The algorithm’s two-stage approach commences with the generation of numerous control input samples that are evaluated using a pre-trained Gated Recurrent Unit (GRU) prediction model, with the highest scoring sequences filtered based on a cost function to ensure uniform sampling over a wide search space. In the second stage, these filtered sequences are refined by incorporating obstacle constraints, such as KOZ, approach corridor, or satellite shape, optimizing the path through parallel processing and ultimately selecting the trajectory with minimal control input consumption. The entire algorithm flow chart is presented in Fig. 10.
The algorithm was applied to Phase 4 and Phase 5 with the requirements specified in Table 5, with fixed constraints. The results are presented in Fig. 11 and Fig. 12. Phase 4 is terminated when the approach within 2 m with respect to P2 is achieved. The thrust profile is shown in Fig. 13. Assuming the successful execution of Phase 4, a Monte-Carlo simulation was conducted for Phase 5 with random P2, which constitutes the starting point of Phase 5. Additionally, a rotating approach corridor was applied with 5 °/s.
TABLE 5.
RPOD mission requirements
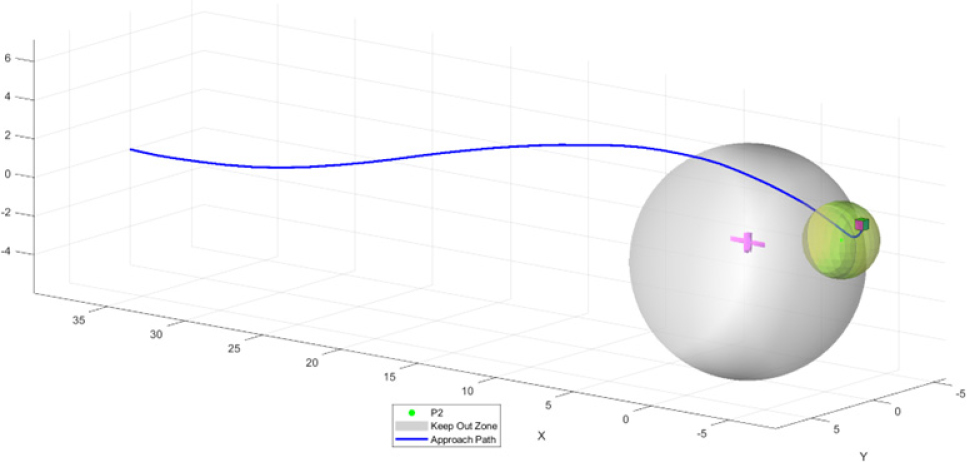
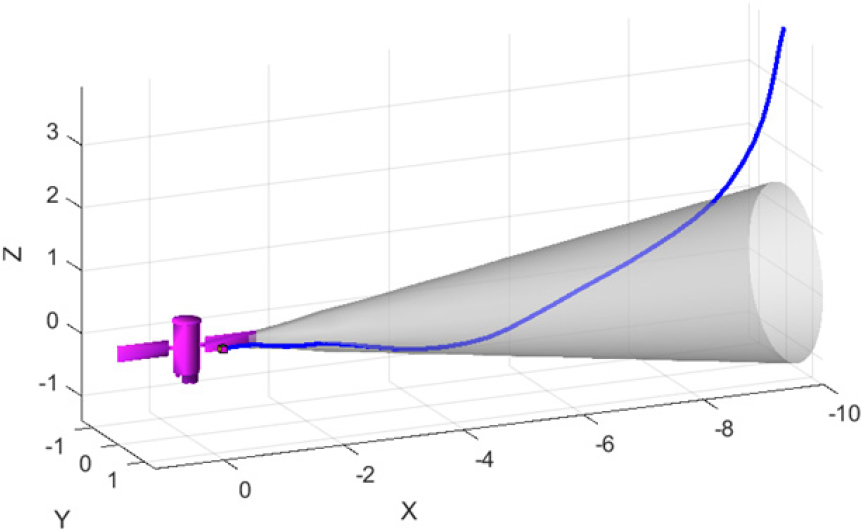
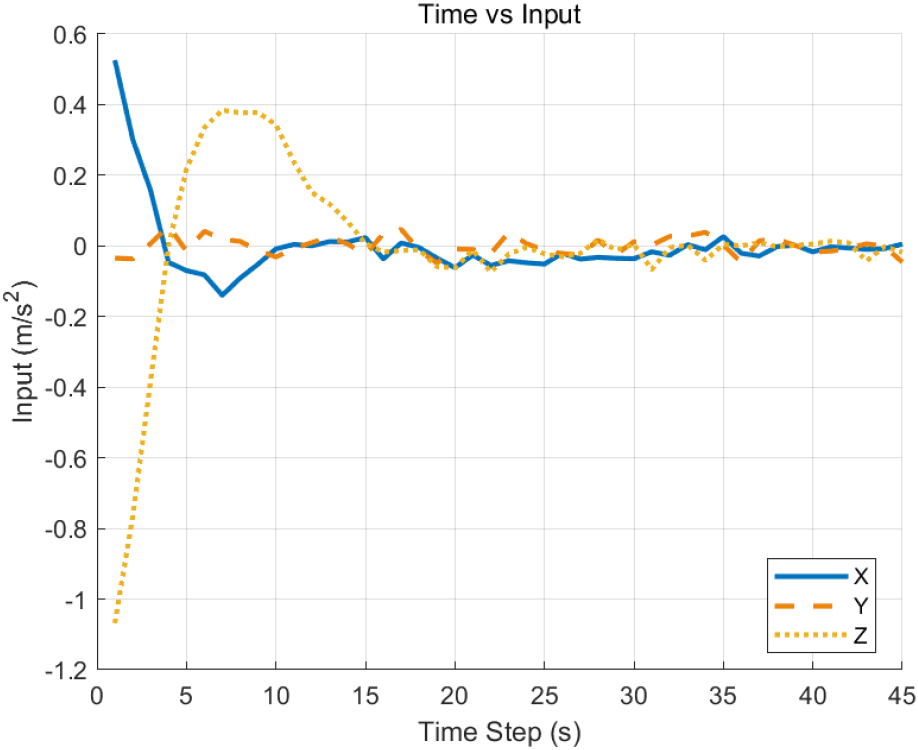
Fig. 14 illustrates the results of the Monte-Carlo Simulation with feasible blue trajectories and infeasible red trajectories. As detailed in Table 6, the simulation was conducted using 100 iterations with random initial points, incorporating an approach corridor rotation of 5 °/s, and achieved a 90% success rate based on the criteria of approaching within 0.1 m with a final relative velocity below 0.01 m/s.
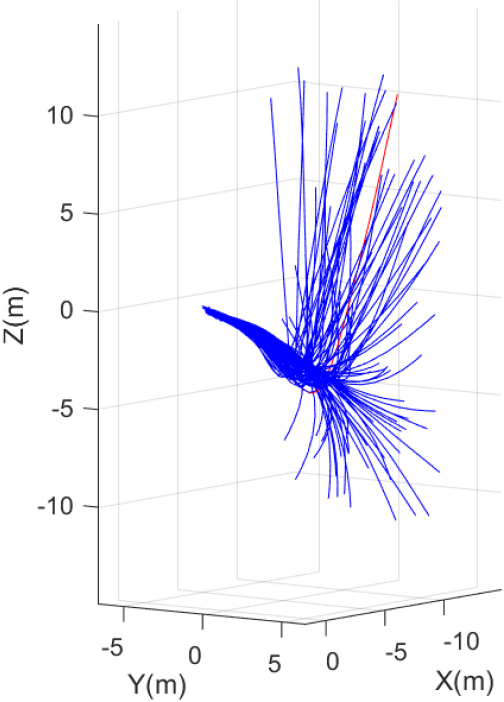
TABLE 6.
Phase 5’s Monte-Carlo simulation
3.3.5. Capture Mechanism Design
3.3.5.1. Mechanism Design Requirements
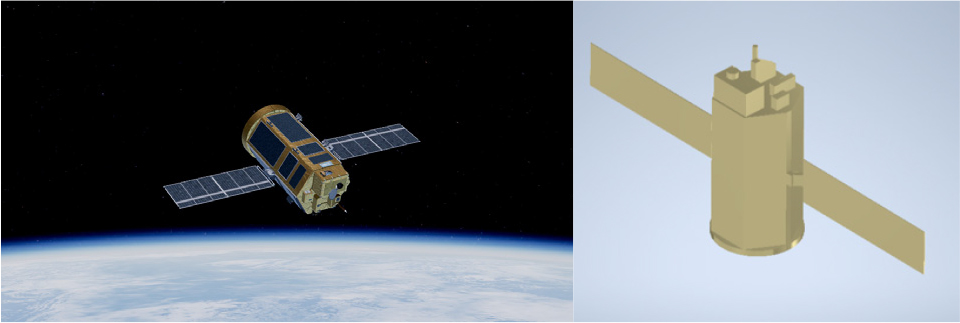
The target satellite comprises an upper payload module, a hexagonal prism-shaped satellite bus with a propulsion module, and two solar panels as depicted in Fig. 15. One face of the satellite bus is a rectangular panel measuring 0.615 m in width and 2.43 m in height [22]. For analytical purposes, we define the direction normal to the hexagonal cross section as the axial direction.
In prior work, harpoon and net-based capture methods were demonstrated in orbit [23]. Both methods significantly enhance the servicer’s survivability by reducing direct contact with the target. However, once the target is captured and during deorbit maneuvers, complex nonlinear tension dynamics can arise, requiring an additional securing process to stabilize the combined system. Furthermore, if the target exhibits rotational motion—a prevalent condition in ADR scenarios—the servicing satellite risks losing control. Since these methods rely on projectile firing, there is also a risk of capture failure from unexpected disturbances near the firing point, and continuous operations require resupplying projectiles.
Therefore, in this work, we propose a physical contact-based capture mechanism that mitigates these risks by reducing relative motion through satellite maneuvers. Several criteria are defined for effective capture: First, a workspace radius of 1.25 m is required based on the geometric relationship between the servicer and the hexagonal target structure; this exceeds the circumcircle diameter of the hexagonal cross-section. Second, because the capture mechanism is directly integrated into the satellite bus, it must satisfy weight, environmental, and geometric constraints. Finally, to effectively apply the necessary forces and torques, the mechanism must achieve either force closure or form closure, while ensuring that bending strain and deformation stress remain within yield limits to prevent structural failure.
The design requirements derived from these considerations are summarized in Table 7, where , min denotes the workspace radius, represents the mass of the link member, signifies link member deformation, and indicates the operating temperature of the mechanism.
TABLE 7.
Capture mechanism design requirements
| Index | Requirements |
| 1 | |
| 2 | |
| 3 | |
| 4 | |
| 5 | no extrusion from bus contour when stowed |
| 6 | achieve force or form closure when deployed |
3.3.5.2. Contact Point Allocation based on Friction Dynamics
To ensure force closure for the target satellite, contact points were strategically positioned according to classical contact mechanics principles. A worst-case contact scenario was assumed by modeling a rigid point contact on the multilayer thin-film insulation (MLI).
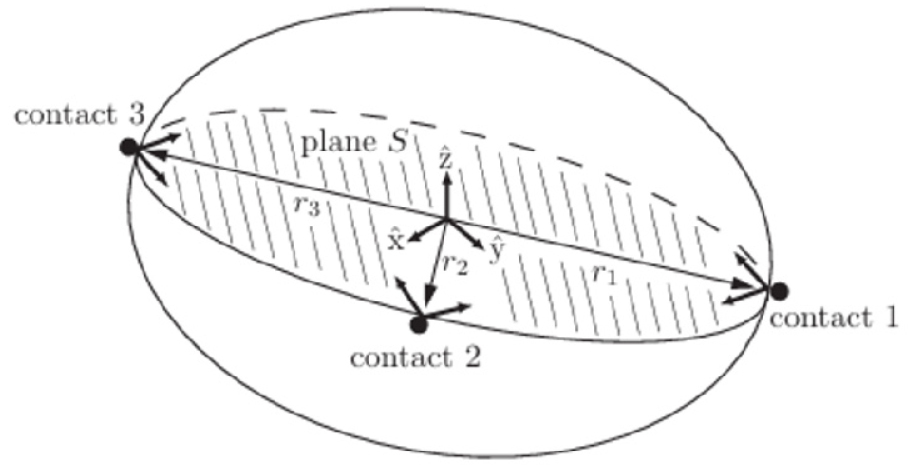
According to three-dimensional Nguyen’s theorem [24], achieving force closure requires satisfying specific conditions. As elucidated in Fig. 16, these conditions establish the requisite mathematical constraints for maintaining stable grasping configurations, ensuring that the applied contact forces effectively counteract external disturbances and maintain a secure hold on the target.
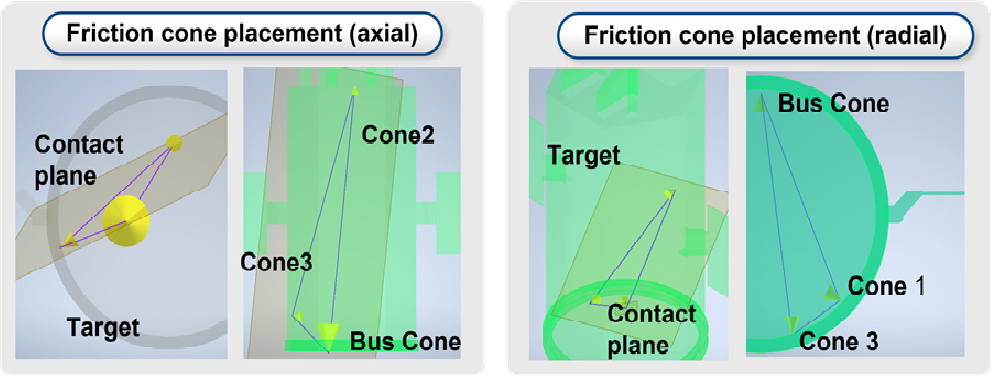
To satisfy design requirement 6, friction cones were allocated for both axial and radial approach scenarios. The resulting allocation is illustrated in Fig. 17.
3.3.5.3. Design Result and Member Deformation Analysis
To accurately position the end-effector at the contact points, a specialized mechanism was designed. For the axial approach, the mechanism’s maximum deployment length must exceed 2.43 m, which corresponds to the axial length of the target. Additionally, to maintain effective attitude control of the servicer when the mechanism is stowed, the overall moment of inertia of the arm must be minimized.
In consideration of these requirements, this research proposes a deployable arm-based capture mechanism. For the radial approach, we propose a simple robotic arm-based mechanism. This method not only enables low-cost retries in the event of capture failure but also leverages the high technological maturity of ground-based robotics, providing strategic advantages in technology acquisition.
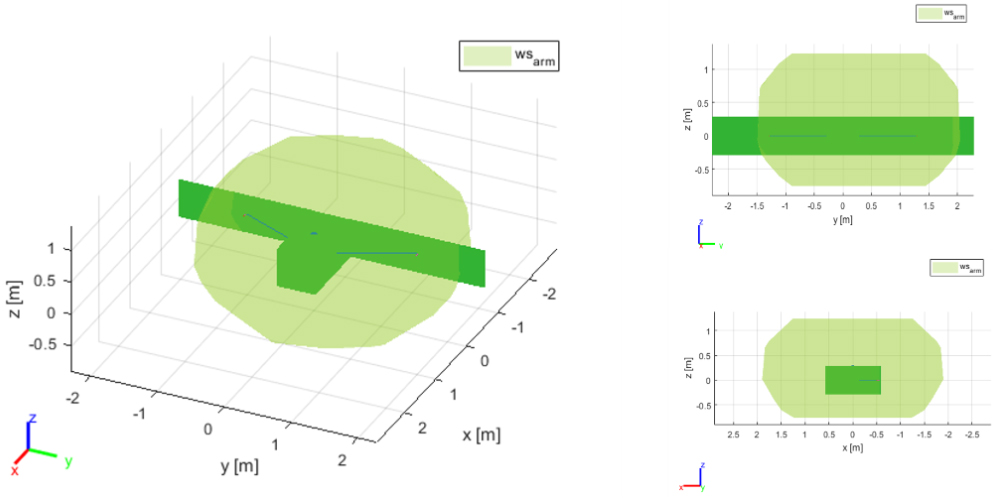
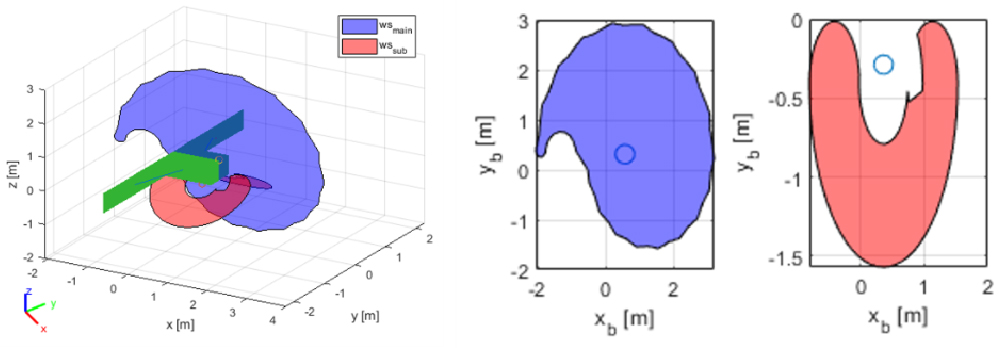
The design results of the proposed mechanism are illustrated in Fig. 18, and the specifications are delineated in Table 8. These findings demonstrate that design requirements 2 and 5 have been satisfied. For design requirement 1, all possible end-effector positions were collected, and the workspace for each mechanism was evaluated. As shown in Fig. 19 and Fig. 20, both mechanisms successfully meet the relevant requirement.
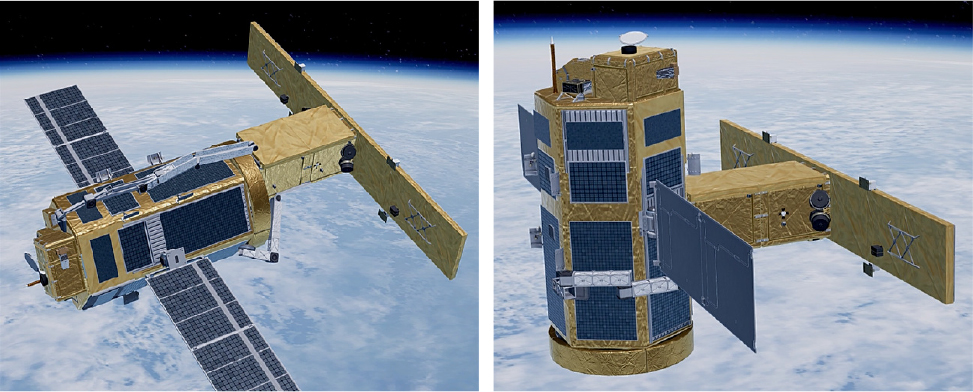
TABLE 8.
Major specification for proposed designs
| Scenario | Axial | Radial |
| (kg) | 23 | 18 |
| (W) | 300 | 230 |
| DOF | 7 | 7 |
| [mm] | 3.2 | 2.2 |
| [%] | 0.74 | 0.68 |
To ensure the mechanism’s precision and to prevent failures from excessive reaction stress, deformation and stress analyses were performed on the component members using the CAD’s built-in finite element method based simulator. Simulation were executed in Autodesk Inventor Professional 2025 on an Intel Core Ultra 7 (3.80 GHz) system with 32 GB of RAM.
The stress analysis encompassed all rigid bodies in the capture mechanism. The joint connecting the parent rigid body was fixed, while the child body was subjected to an 8 Nm torque representing the saturated torque from a 25 W BLDC motor with a 180:1 reduction ratio and a 250 N reaction force applied at the farthest point from the joint.
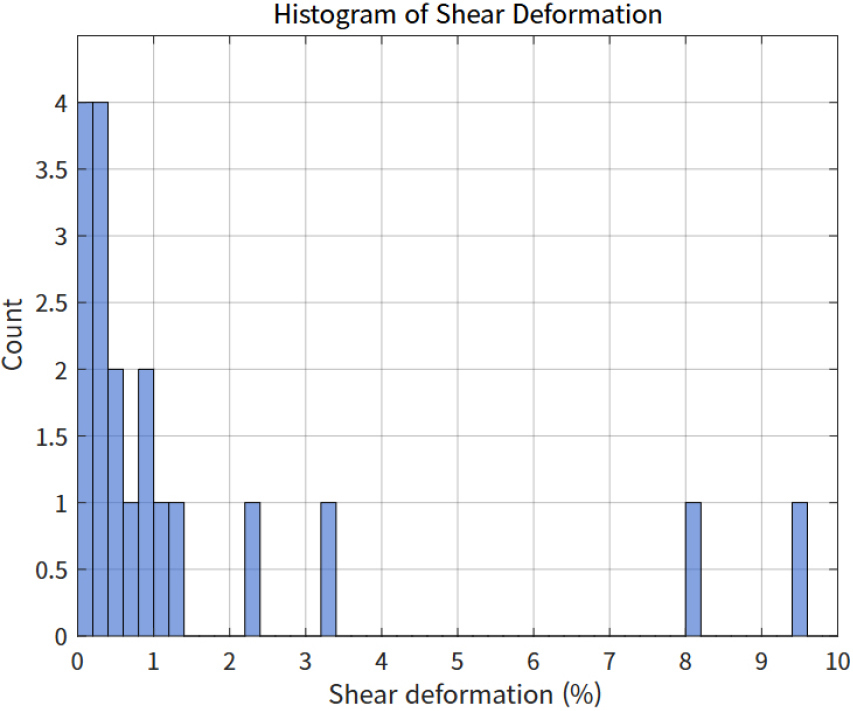
Fig. 21 illustrates the strain histogram across all members. According to the design requirement in Table 7 (which specifies a maximum allowable strain of 1% or 10‰, corresponding to 3𝜎 within the overall strain distribution), the results confirm that the proposed design meets the specified criteria.
3.4. Phases 6-7: Deorbit and Re-entry
3.4.1. Deorbit
The final state of the RPOD phase culminates in the robust capture of the target, KOMPSAT-1, by the ADR satellite. The ADR satellite must maintain physical contact with the target, functioning as a single rigid body. In this state, a deorbit maneuver is required to remove the target through atmospheric re-entry and burn-up. To effectuate deorbit, thrust must be applied in the direction opposite to the velocity vector, gradually lowering the altitude.
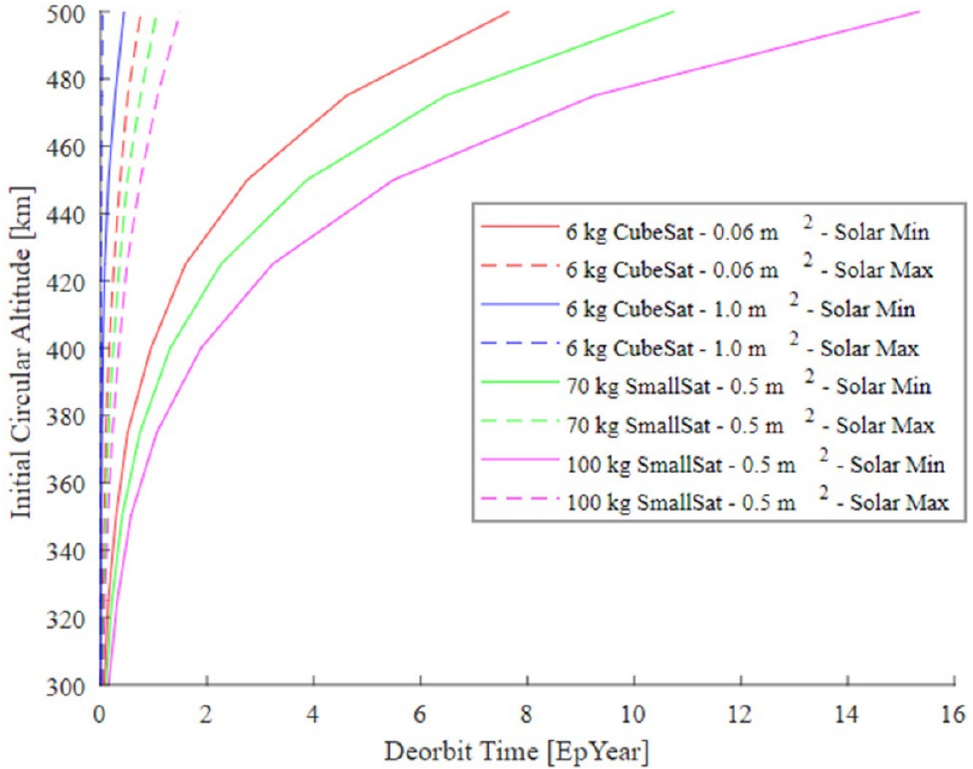
According to research conducted by NASA Ames Research Center [25], as indicated by the analysis in Fig. 22, spacecraft at altitudes above 500 km are not expected to decay naturally. However, commencing at approximately 300 km, deorbit can be achieved within a short timeframe, with relatively minor influence from the spacecraft’s mass or solar activity. Therefore, in this work, deorbit analysis is carried out at an altitude of approximately 300 km.
Deorbit is primarily influenced by Earth’s gravity and atmospheric drag. The atmospheric drag is expressed by the following Eq. (10):
where is the drag force, 𝜌 is the atmospheric density, is the drag coefficient, is the cross-sectional area, and is the relative velocity. The atmospheric drag is determined by each of these factors. Notably, the drag area can vary with the satellite’s attitude during re-entry; however, its range and upper limits can be reasonably estimated. The drag coefficient is a dimensionless parameter describing how a body’s shape and surface materials interact with the atmosphere, and for satellites it is typically assigned values between 1.5 and 3.0 [26]. Each parameter is specified in Table 9.
TABLE 9.
Deorbit Simulation Parameter
| Parameter | Value |
| Total Mass (kg) | 683.92 |
| Drag Coefficient | 2.2 [26] |
| Drag Area () | 5 |
| Drag Model | MSISE-90 |
| Gravity Model | EGM-96 |
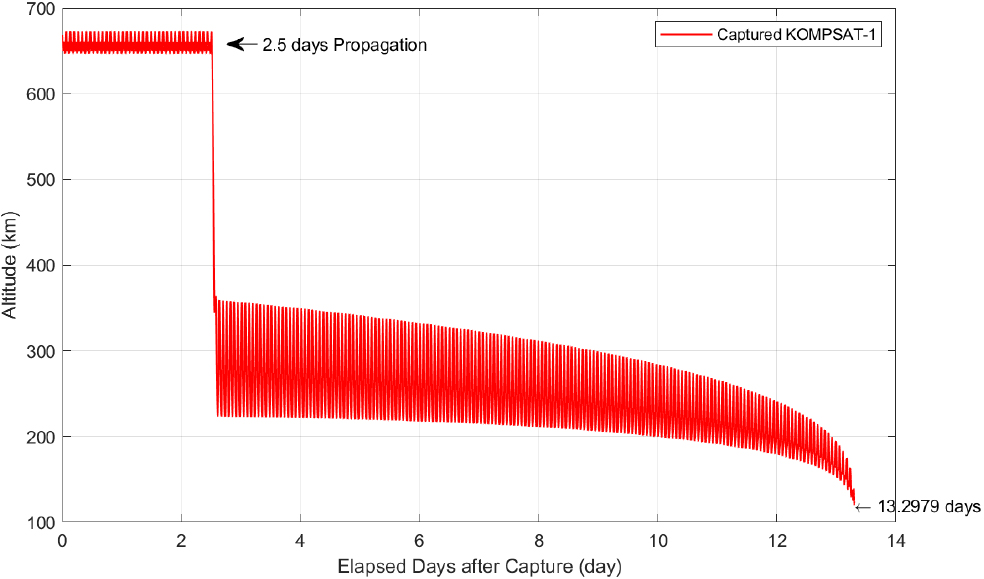
Using NASA GMAT, we simulated the process in which an ADR satellite having successfully captured the target gradually lowers its altitude through approximately four hours of finite burns, reaching an orbit with an apogee of about 330 km and a perigee of about 230 km. The simulation then propagates the satellite’s descent to 100 km altitude under the influence of atmospheric drag and gravity. The simulation parameters include spacecraft mass, drag coefficient, and drag area; the atmospheric model is MSISE-90, and the gravity model is EGM-96.
The results as shown in Fig. 23 indicate that when the orbit is established and propagated from around 300 km, the altitude decreases to 100 km in roughly 7 to 14 days. While variations in epoch and solar activity can engender slight differences under different simulation conditions, the findings suggest that initiating deorbit near 300 km allows for re-entry within a relatively short timeframe [2].
3.4.2. Conjunction Assessment
In recent analogous technological demonstrations and past docking missions, visual sensors and sensor-based navigation have been predominantly oriented toward docking or capturing the target. Consequently, once capture has been completed, there is a high likelihood that visual-based navigation cannot be subsequently applied. Therefore, the deorbit phase is likely to rely solely on GPS or ground-based position data or on maneuver commands.
Such a limitation implies that if a conjunction or collision scenario arises with another space object (debris) during this process, the capability to detect the object using visual sensors and execute algorithm-based avoidance could be substantially constrained. This research performs a Conjunction Assessment (CA) during the deorbit phase to analyze potential collision risks. This analysis is carried out using SPACEMAP’s algorithm [27,28].
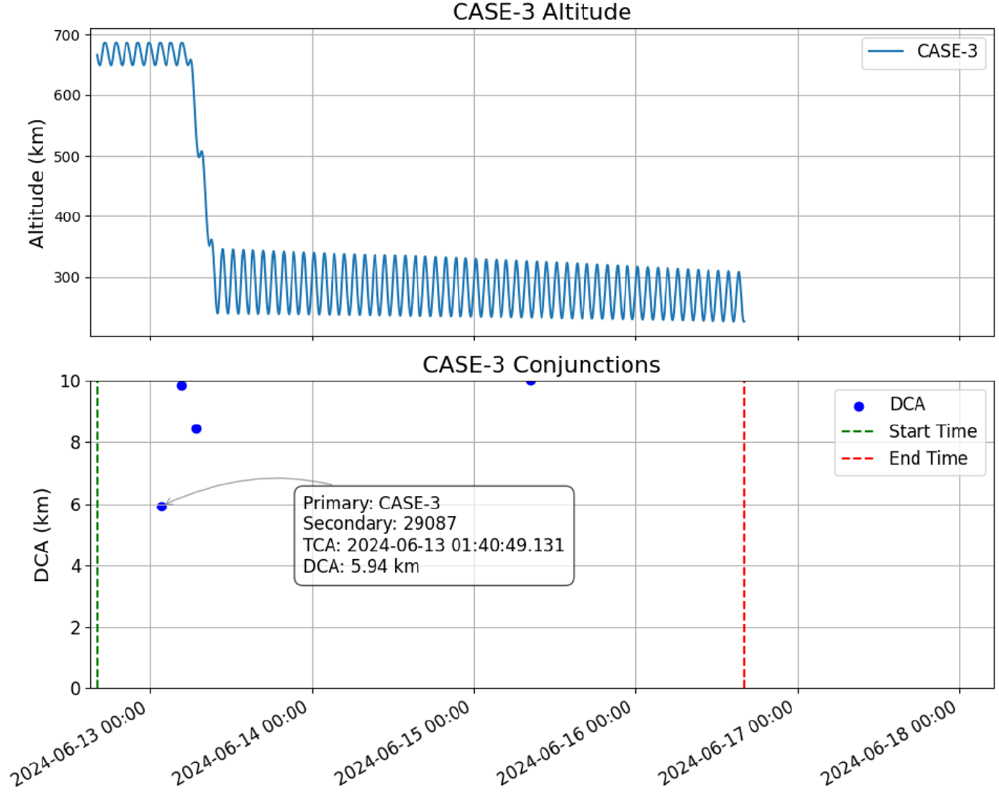
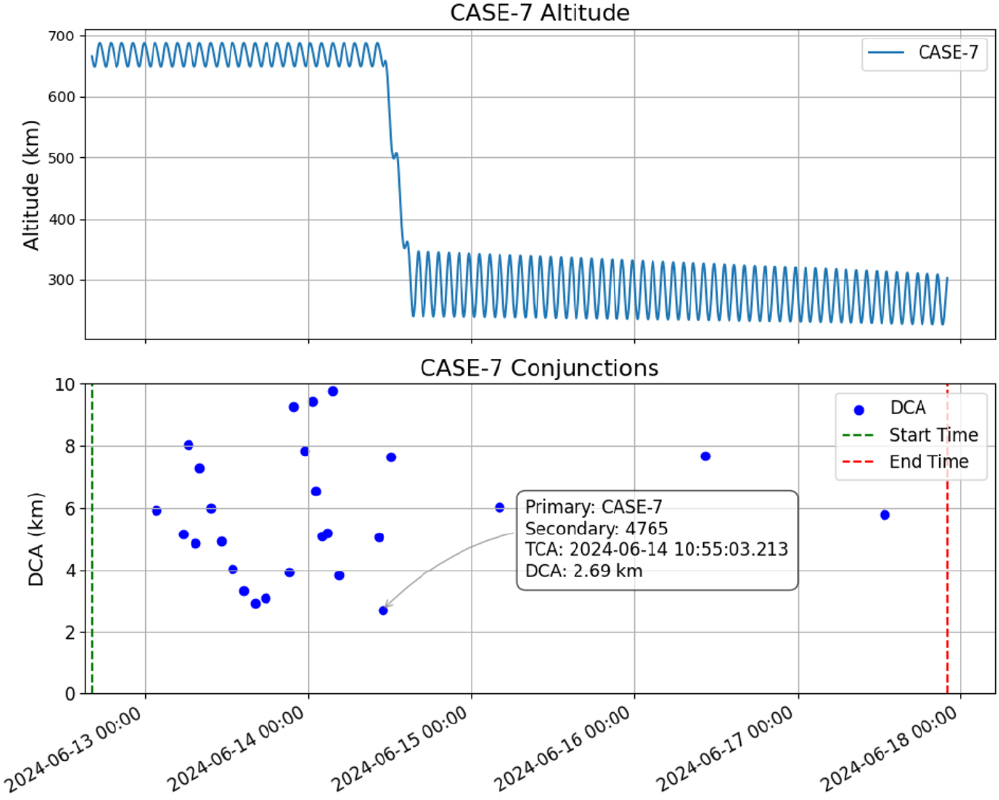
Fig. 24 illustrates seven different scenarios in the deorbit phase, each with a varying propagation interval following the capture stage. These scenarios were analyzed to determine which one provides the largest Distance of Closest Approach (DCA) and the lowest Probability of Collision (PoC), thereby ensuring a safe maneuver to avoid collisions during the deorbit phase. In each case, the orbital descent commences 0.25 to 0.5 days after capture. The capture time is established at UTC Gregorian 12 Jun 2024 16:11:34.748 (UTC ModJulian 30474.17470773148).
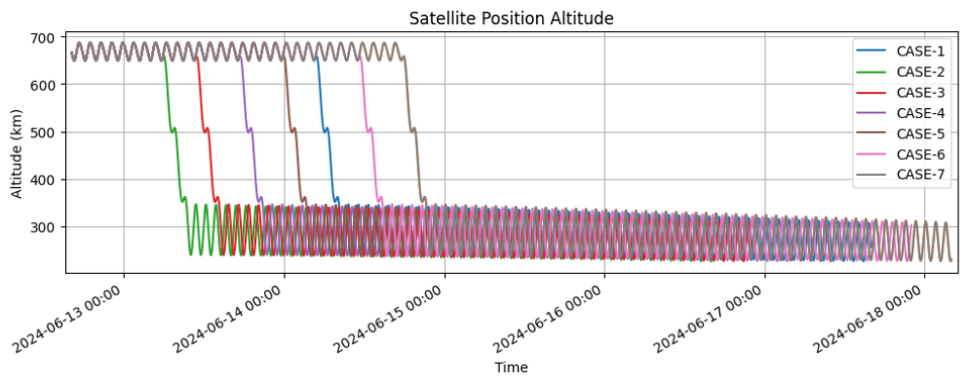
According to the analysis, the scenario with the greatest DCA is Case 3, as shown in Fig. 25, in which the maneuver begins approximately 0.5 days after capture. At the Time of Closest Approach (TCA) on 13 Jun 2024 01:40:49.131, the object with NORAD ID 29087 was found to approach as close as 5.94 km. NORAD ID 29087 is DMSP 5D-2 F11 DEB, launched on November 28, 1991, retired in 1995, and underwent fragmentation in orbit in 2004, producing multiple debris fragments from the U.S. Department of Defense’s DMSP 5D-2 F11 weather satellite. This debris fully reentered the atmosphere in November 2024, resulting in its disintegration. The PoC converges to zero, indicating that stable altitude decay is feasible.
Conversely, the scenario with the smallest DCA is Case 7, shown in Fig. 26, in which descent begins after 1.75 days and 2 days of propagation following capture. At the TCA on 14 Jun 2024 10:55:03.2, the object with NORAD ID 4765 approaches as close as approximately 2.69 km. NORAD ID 4765 is debris from the United States Thorad-Agena D rocket, launched on April 8, 1970. While the PoC in this scenario also approaches zero, implying minimal actual risk of collision, analyses of multiple scenarios are undertaken to verify collision potential and determine whether a collision avoidance maneuver is necessary.
3.5. Simulation Result and Its Feasibility
The mission phases were systematically partitioned into discrete operational segments, as outlined in Table 10, to calculate the required . For a small satellite weighing approximately 300 kg and having an Isp of 250 seconds, the total fuel consumption was estimated to be approximately 132 kg for both finite and impulsive burns throughout the mission phases.
TABLE 10.
Mission phases and its results [2]
4. CONCLUSION
In this paper, we developed and analyzed a baseline conceptual design for an ADR mission, incorporating ConOps, guidance, navigation, and control (GNC) algorithms, capture mechanisms, and deorbit and re-entry strategies. Essential components of ADR were examined across different mission phases, including: the design and analysis of approach scenarios; vision-based sensor navigation and collision avoidance path-planning algorithms for close-range operations; the development of a robotic arm-based capture mechanism; and the design of a relocation orbit with drag analysis for orbit transition. Additionally, the impact of injection point variations was investigated to assess potential collision risks during the final transition phase. Based on these analyses, an ADR mission scenario was established, and the efficiency and feasibility of the proposed approach were evaluated.
To implement the defined scenarios, design requirements for each GNC algorithm were first specified. A point cloud-based navigation algorithm was developed to meet computing and sensing demands during the RPOD phases. An obstacle recognition algorithm based on polynomial fitting was also designed and its tracking accuracy verified. Subsequently, a path optimization method incorporating polynomial constraints was proposed, demonstrating the effectiveness of the designed collision avoidance paths. The capture mechanism’s performance was assessed from multiple perspectives, considering simple friction dynamics for contact interaction and optimizing contact points for secure grasping. Additionally, workspace analysis and component deformation studies were conducted to refine the design. Lastly, key rendezvous mission phases were designed, mission and subsystem requirements were defined, and operational techniques for capture execution were refined.
Our work provides a foundational framework for future ADR studies and mission designs. We anticipate that this research will contribute to the empirical development of medium-sized satellite capture technologies, offering relevant advancements for future ADR applications. Building on these fundamental technologies, future work will focus on the preliminary design of a dedicated capture satellite, which will not only enhance capture capabilities but also contribute to the broader development of in-space servicing, assembly, and manufacturing technologies.

