

1. INTRODUCTION
2. MATERIALS AND METHODOLOGY
2.1. KOMPSAT-2 Satellite Overview
2.2. Telemetry Dataset and Preprocessing
2.3. Anomaly Labeling Method
3. RESULTS AND DISCUSSIONS
3.1. Exploratory Data Analysis of Telemetry
3.2. Anomaly Detection Application and Case Studies
4. CONCLUSION
1. INTRODUCTION
Over the past few decades, the satellite operations landscape has evolved rapidly. The New Space era has accelerated the deployment of numerous small satellites, leading to a dramatic increase in the population of active spacecraft in Earth orbit [1]. This rapid growth escalates operational complexity and shifts the focus toward multi-satellite operations, where a limited number of operators must monitor and manage multiple spacecraft simultaneously. Consequently, demand has surged for automated, intelligent monitoring capabilities that can scale with increasing data volume and mission complexity. Industrial examples include constellation operators that rely heavily on automation, as well as major aerospace companies developing cloud- and AI-enabled systems designed to allow a single operator to supervise multiple missions [2,3].
Korea is undergoing a similar transition. With the establishment of a national integrated satellite operations center and government plans to expand the development and deployment of small satellites, the number of spacecraft requiring routine monitoring is projected to increase significantly. In such an environment, linearly scaling operations staff in proportion to the satellite count is not a sustainable solution due to cost, staffing, and infrastructure constraints. Achieving both operational efficiency and mission safety, therefore, necessitates methodologies that can systematically extract and interpret critical information from vast volumes of operational data.
Satellite telemetry serves as the primary data foundation for such methodologies. It consists of a continuous stream of spacecraft health and status information, generated by onboard sensors and subsystems and transmitted to the ground. Modern satellites generate millions of telemetry points per day across thousands of channels, rendering exhaustive manual monitoring infeasible [4]. Traditional monitoring approaches—such as fixed thresholds and rule-based logic embedded in conventional fault detection, isolation, and recovery (FDIR) frameworks—remain useful; however, they are limited in their ability to capture unforeseen anomaly patterns or complex multivariate fault signatures [5]. Moreover, they can suffer from missed detections or false alarms when system behavior deviates from pre-defined assumptions.
Recent advances in machine learning and deep learning have motivated the development of data-driven approaches that learn nominal multivariate patterns directly from telemetry and detect subtle deviations that may precede failures [6,7]. Major space agencies and research communities have explored such approaches, including in-orbit demonstrations on small satellite missions, indicating a broader shift from reactive operations toward proactive, preventive health management [8,9]. In addition to operational benefits, developing domestic capability in telemetry-based anomaly detection is strategically important for reducing dependence on external solutions and for strengthening resilient, trustworthy operational infrastructure [10]. Furthermore, establishing an independent anomaly detection capability is a critical requirement for space security, ensuring the continuous protection of national space assets against both internal failures and potential external interference [11].
From a space-security perspective, telemetry-based anomaly detection can also support the early identification of operational effects caused by intentional threats, such as cyber intrusion, unauthorized command attempts, signal interference, or jamming-induced communication degradation. Although telemetry analysis alone cannot determine the intent or source of an event, it provides an important technical layer for recognizing abnormal spacecraft behavior and preserving the resilience of national space assets.
Against this background, the objective of this study is to establish a practical foundation for AI-based anomaly detection using long-term satellite telemetry. Using KOMPSAT-2 as a case study, we (i) constructed an analysis-ready dataset from long-duration operational telemetry, (ii) performed preprocessing and feature-oriented characterization, (iii) identified and labeled a limited set of known anomaly events based on operations reports, and (iv) reviewed and tested representative anomaly detection methods, primarily in an unsupervised setting due to the scarcity of labeled fault data. While this work focuses on detection rather than diagnosis or recovery, it aims to demonstrate feasibility and provide a methodological basis for future scalable, intelligent health-monitoring systems for multi-satellite operations.
2. MATERIALS AND METHODOLOGY
2.1. KOMPSAT-2 Satellite Overview
KOMPSAT-2 (Korea Multi-Purpose Satellite-2), also known as Arirang-2, is an Earth-observation satellite developed by the Korea Aerospace Research Institute (KARI). It was launched on 28 July 2006 from the Plesetsk Cosmodrome in Russia aboard a ROCKOT launch vehicle. KOMPSAT-2 operates in a sun-synchronous orbit (SSO) at an altitude of approximately 685 km, orbiting the Earth about 14.5 times per day. The spacecraft is a medium-class satellite with a launch mass of approximately 800 kg. It carries a high-resolution optical payload that provides 1 m panchromatic and 4 m multispectral imagery, allowing for the acquisition and downlink of high-quality surface images. The satellite performed nominal mission operations for about nine years, delivering high-resolution imagery to domestic and international users. After the official termination of mission operations in 2015, KOMPSAT-2 transitioned to a limited-operation phase for research purposes, during which additional data were collected. Throughout its operational lifetime, a large volume of telemetry data was collected. This data includes subsystem status information and event logs from key functions, such as the electric power subsystem (EPS), attitude and orbit control subsystem (AOCS), thermal control subsystem (TCS), telemetry, tracking and command/communication subsystem (TCRS), and the multispectral camera (MSC) payload. Consequently, the dataset captures a wide range of nominal and off-nominal behaviors and is a valuable real-world resource for data-driven analysis.
2.2. Telemetry Dataset and Preprocessing
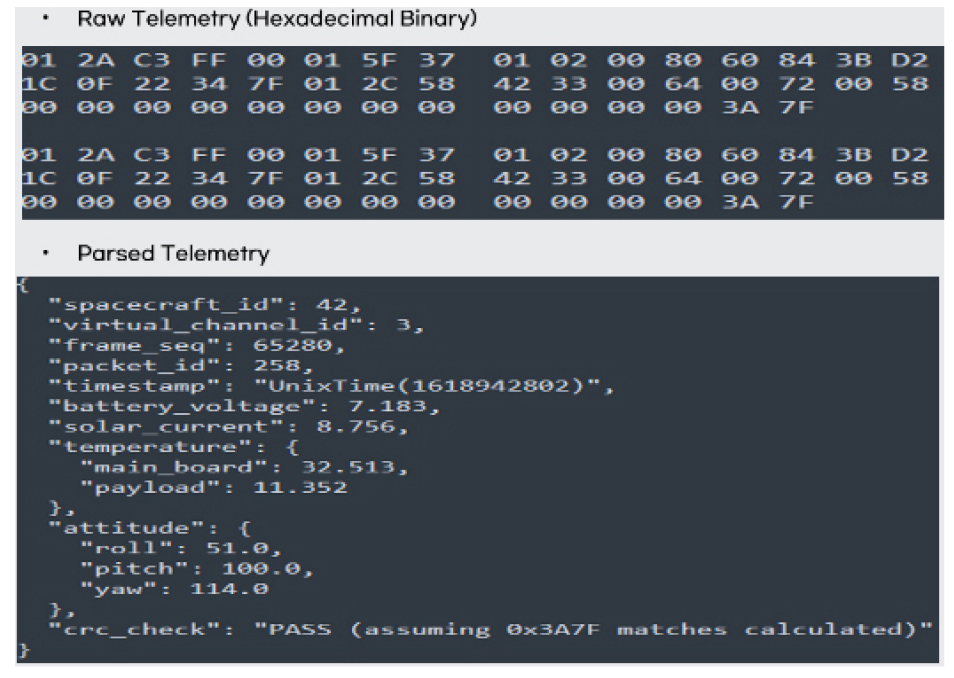
Telemetry data consists of multidimensional time series continuously generated by onboard sensors over time. The raw telemetry transmitted from KOMPSAT-2 to the ground is a binary stream in CCSDS packet format. Once received at the ground station, it is converted into engineering unit values that operators can interpret. In this study, we collected 5,872 raw telemetry files covering the entire operational period of KOMPSAT-2 from August 2006 to September 2022.
Since raw data is not directly suitable for analysis, we first constructed a structured time-series dataset using a telemetry parsing pipeline. Calibration and definition information from the spacecraft development phase, such as the Telemetry Allocation Document (TAD), was used to decode raw packets, convert sensor channels to physical values, and arrange them in chronological order. Table 1 summarizes the major steps of this workflow. Specifically, the pipeline receives raw frames, extracts relevant fields, applies calibration equations to calculate physical values (e.g., voltage and temperature), and stores the results in a time-series database. The data structure of the raw and parsed telemetry resulting from this pipeline is shown in Fig. 1.
Through this process, we built a long-term telemetry dataset spanning approximately 16 years. Most days contain data, and the average daily acquisition rate exceeds 95% per year. The total dataset size is 158 GB, comprising approximately 2,900 sensor channels (mnemonics). Each data point includes a UTC timestamp and the corresponding sensor measurement, with sampling intervals depending on the channel—ranging from a few seconds to several hours.Given the diversity of telemetry channels, preprocessing is essential to make the data ready for analysis. Specifically, KOMPSAT-2 telemetry has different sampling intervals for each subsystem, which makes direct time alignment difficult. Some channels also contain noise and missing values. We applied the following steps:
TABLE 1.
Summary of the Telemetry Parsing Process
2.2.1. Synchronization and Resampling
To analyze multiple channels on a single timeline, we reconstructed irregular intervals into a uniform grid. We defined a shared grid at a one-second resolution and resampled each channel using linear or zero-order hold interpolation. This allowed variables with different sampling rates to be aligned for multivariate analysis.
2.2.2. Missing-Value Handling
For gaps caused by reception errors, we filled missing data using simple interpolation. Very short gaps were filled by carrying forward the last valid value. Channels with long, continuous missing periods (e.g., unused instruments) were excluded from the analysis.
2.2.3. Outlier Screening
Sensor values that are physically impossible (e.g., negative power values) were removed based on predefined thresholds. We also flagged extreme values beyond $6\sigma$ as outliers. Z-score standardization provided a consistent basis for identifying these anomalies across channels with different scales.
2.2.4. Normalization
Each variable was normalized using Z-score standardization (mean of $0$ and standard deviation of $1$). This helps the model learn relative change patterns across channels and serves as a standard input for most anomaly detection methods.
2.2.5. Feature Extraction and Transformation
We derived additional features such as moving averages and standard deviations. We also used representation learning, like autoencoders, to obtain low-dimensional variables that summarize high-dimensional telemetry. These steps help characterize the data structure for subsequent anomaly detection models.
2.3. Anomaly Labeling Method
In complex systems like spacecraft, operations teams collect many anomaly and failure reports describing off-nominal events observed during flight. In this study, we reviewed approximately 300 reports for KOMPSAT-2 and selected cases caused by the spacecraft’s internal state for data labeling. While these reports document issues, root causes, and corrective actions, most events were related to external factors such as communication outages, ground-station issues, and space-environment effects. Cases classified as internal subsystem anomalies were relatively rare, but clear signatures in telemetry were found in events related to the Attitude and Orbit Control System (AOCS) and the Multi-Spectral Camera (MSC). We focused on these events and consulted with operations engineers to identify representative cases for anomaly detection. The labeling procedure followed a collaborative process between analysts and domain experts. First, we identified the event time windows and relevant sensor channels based on the reports. We then extracted the corresponding telemetry segments and assigned labels to the anomalous intervals. For example, when a report indicated an “AOCS sensor anomaly on 10 May 2020,” the telemetry of the associated channels was labeled as anomalous around that date and recorded as off-nominal samples. This partially labeled dataset was used for model validation and performance assessment. Since it was not possible to get enough labeled data for supervised learning, we used the labeled events as a test set and trained the models in an unsupervised manner. Specifically, we assumed most of the telemetry is unlabeled, learned normal patterns from the data, and detected deviations as anomalies. We then used the limited labeled events to evaluate detection performance. This hybrid strategy is practical for spacecraft telemetry: even without labels, modeling normal behavior can detect many anomalies, and small amounts of labeled data can be used to improve detection reliability.
3. RESULTS AND DISCUSSIONS
3.1. Exploratory Data Analysis of Telemetry
We performed various exploratory analyses on the constructed KOMPSAT-2 telemetry dataset. First, we reviewed basic descriptive statistics to characterize the distribution and range of each channel. Most sensor measurements were within physically expected bounds; however, extreme outliers were found in some channels. For example, specific voltage sensors in the electric power subsystem (EPS) showed intermittent spikes outside the normal range, suggesting sensor noise or measurement errors.
3.1.1. Periodicity Analysis and STL Decomposition
Many channels showed clear periodicity. Due to the sun-synchronous orbit, a 24-hour pattern appeared in multiple sensor streams. In particular, solar array currents and spacecraft temperatures in the EPS repeatedly changed with the orbital day-night cycle. Some variables also showed longer-term patterns, such as annual oscillations. To separate these components, we decomposed selected time series into trend, seasonal, and residual terms using STL (Seasonal-Trend Decomposition using Loess).
As an example, applying STL to a representative EPS measurement channel revealed a distinct daily pattern and a gradual long-term decrease. In contrast, a specific payload event counter channel showed weak seasonality but featured intermittent large spikes. Analysis of this event counter showed that the trend component has a long-term increase, suggesting that the frequency or size of these events grows over time. The seasonal component highlights an intra-day pattern where events concentrate at specific times, while the residual component contains only non-periodic outliers. These observations imply that event behavior is condition-dependent. This increasing trend may reflect aging effects, highlighting the need for early detection. By isolating the residual component, we can focus on non-periodic, transient signals that are most likely to contain anomaly signatures. This decomposition provides the AI model with a clearer signal, reducing the false alarm rate caused by normal seasonal variations.
3.1.2. Multivariate Correlation and Hierarchical Clustering
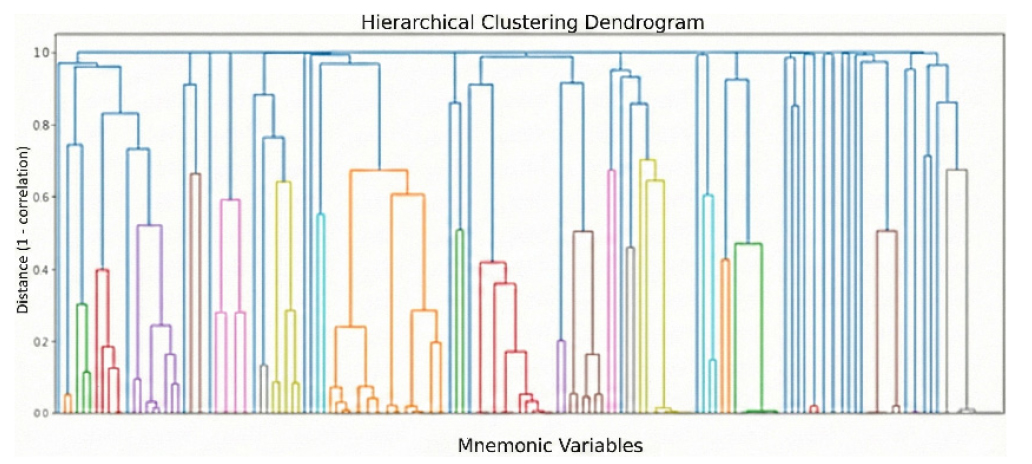
To analyze sensor relationships, we performed multivariate correlation analysis on about 150 channels selected for their variability and importance to operations. Sensors within the same subsystem often showed strong correlations, such as the three-axis gyroscope in the AOCS or the voltage, current, and temperature channels in the EPS. We then applied hierarchical clustering to visualize this correlation structure. Fig. 2 shows the resulting dendrogram, illustrating groups of sensors with similar behavior and revealing the latent structure in the telemetry space. Selecting representative channels from highly correlated groups helps reduce dimensions and removes redundancy in subsequent modeling.
3.1.3. Temporal Variability and Stability Indicators
We also analyzed how variability changed over mission phases by tracking outlier rates. Specifically, we divided the operational timeline into annual intervals and monitored the proportion of outliers for each channel. Most channels showed stable or decreasing outlier rates over time. However, some channels displayed a sharp increase in outliers during certain years, potentially indicating sensor degradation or environmental effects. When using the mean outlier rate as a stability indicator, some sensors remained highly stable with near-zero rates, while others exceeded 5%, suggesting persistent noise or intermittent faults. For the latter group, reducing trust weights or applying special handling may be necessary in subsequent modeling. Overall, these statistical assessments provide practical insights for designing anomaly detection models and helping operators interpret long-term telemetry behavior.
3.2. Anomaly Detection Application and Case Studies
Using the dataset and preprocessing results, we performed experiments to find off-nominal signals in KOMPSAT-2 telemetry using several anomaly detection methods. As mentioned earlier, because labeled anomaly cases were very limited, we chose unsupervised anomaly detection models instead of supervised ones.
3.2.1. Unsupervised Anomaly Detection with an Autoencoder
One common method was an autoencoder-based model that learns normal patterns and identifies anomalies through reconstruction error. Specifically, we trained the model using data collected before 2014 and evaluated it on data from 2015 to the end of the mission. This simulates a situation where anomalies in later mission phases are detected compared to earlier normal behavior. The trained autoencoder kept reconstruction errors low for most channels. However, during several labeled anomaly windows, the reconstruction error increased sharply. This shows that patterns appeared outside the learned normal range and suggests the model successfully found known anomaly events. The model also flagged some potential anomalies without labels. For example, in 2012, a temperature channel showed an abrupt change, resulting in a high reconstruction error. Although this was not in the official reports, checking the operational logs confirmed that an orbit maneuver occurred at that time. This supports the idea that the detected deviation reflected a real operational event. These results show that unsupervised anomaly detection can capture off-nominal behaviors that were not previously defined or documented.
3.2.2. Density-Based Outlier Detection (LOF and Isolation Forest)
As another approach, we applied density-based outlier detection algorithms to selected parts of the telemetry. Specifically, we tested Local Outlier Factor (LOF) and Isolation Forest (IF). Both models measure how much a data point deviates from nearby samples based on density or partitioning in the feature space. LOF identified points far from the normal cluster in multiple sensor streams, including times that match the labeled anomaly events. For the Isolation Forest, we set the threshold to classify the top 0.5% of samples as anomalies. These results largely overlapped with the periods mentioned in operations reports or those previously flagged by the autoencoder.
Although the quantitative evaluation was constrained by the limited number of labeled anomaly events, we conducted a representative evaluation using anomaly windows derived from the available anomaly reports and telemetry threshold information. In this evaluation, the thresholded anomaly-score output achieved an accuracy of 0.9984, precision of 0.8642, recall of 1.0000, and F1-score of 0.9272 under the most selective threshold setting. When the threshold ratio was changed from 0.30 to 0.01, precision increased from 0.3933 to 0.8642 and the F1-score increased from 0.5645 to 0.9272, while recall remained 1.0000. These results indicate that the detected anomaly intervals were largely consistent with the labeled events, although threshold selection remained important for reducing false alarms. Therefore, time windows highlighted by multiple methods were interpreted as highly probable anomaly candidates rather than definitive fault labels. In future work, ensemble strategies, cross-model verification, and post-processing rules will be further investigated to improve detection reliability and reduce false alarms.
3.2.3. Case-Based Interpretation of Labeled Events
We also performed a case-based analysis of the labeled anomalies. For example, for an event labeled as a “payload data-transmission segment mismatch,” we observed abnormal changes in memory indicators and a rise in communication error flags. This matches a pattern of repeated retransmissions caused by data loss during transmission. In another case labeled as a “mass-memory scrub error,” telemetry showed rapid changes in OBC memory usage and an increase in bus communication errors. This is consistent with scrub operations being triggered by storage-related issues. For security reasons, the full list of labeled cases and their telemetry signatures is kept only as an internal record. Therefore, this paper reports only the common signatures and their monitoring implications.
3.2.4. Implications and Future Extensions
Overall, the results demonstrate that applying data mining and anomaly detection to long-term satellite telemetry is an effective and practical approach. Although this study focused on a single spacecraft (KOMPSAT-2), the methodology successfully detected known anomalies and identified several undocumented deviations. Multivariate analysis played a crucial role in providing context for these anomalies, allowing analysts to infer plausible operational causes. In particular, unsupervised learning proved to be a viable solution to the realistic constraint of scarce labeled fault data, enabling the detection of novel and unforeseen patterns.
However, moving from detection to accurate root-cause diagnosis remains a significant challenge. Distinguishing between a simple sensor artifact and a genuine component-level failure requires deep domain knowledge and specialized follow-up analysis. Therefore, for actual operational deployment, it is essential to combine these AI models with explainable AI (XAI) mechanisms and the expertise of experienced mission engineers.
Beyond ground-based analysis, the ultimate goal for future multi-satellite operations is the transition toward onboard AI. Onboard implementation is critical not only for immediate, real-time response but also for the efficient management of communication bandwidth. By performing initial anomaly screening directly on the spacecraft flight computer, ground stations can focus their resources on high-priority alerts. This shift from reactive monitoring to proactive, onboard intelligence will significantly enhance the scalability and resilience of national space assets in increasingly complex operational environments.
4. CONCLUSION
In this study, we analyzed long-term satellite telemetry and tested the feasibility of using multivariate time-series data mining to detect spacecraft anomalies. We parsed and cleaned raw KOMPSAT-2 telemetry from 2006 to 2022. By labeling known fault events, we built a foundation for applying anomaly detection models. The main outcomes are as follows:
First, we built an integrated time-series dataset by combining long-term data in different formats (5,872 daily files). To efficiently handle this large-scale dataset of about 2,900 channels, we established a preprocessing pipeline. This pipeline includes time synchronization, interpolation, outlier and missing-value handling, and normalization. This process created an analysis-ready dataset for training multivariate AI models. Second, we performed exploratory data analysis (EDA) using basic statistics, visualization, STL-based decomposition, and clustering-based correlation analysis to find telemetry patterns and off-nominal signals. By measuring daily periodic behavior, subsystem-level correlations, and trends in outliers, we obtained clear cues to understand spacecraft behavior and support anomaly detection. Third, we identified several real spacecraft fault events from reports and assigned labels to those telemetry intervals. By linking reported sensor anomalies to their patterns in telemetry, we created reference cases for future model training and evaluation. Fourth, we applied unsupervised anomaly detection algorithms that model normal behavior without labels and showed that multiple off-nominal signals in KOMPSAT-2 telemetry can be successfully found. Specifically, the autoencoder model showed high reconstruction errors during fault events. Density-based methods, such as Isolation Forest and Local Outlier Factor, also ranked known anomalies as significant outliers. These results show that machine learning is effective for automated anomaly detection in satellite telemetry.
There are some limitations. First, since we used data from only one satellite, the results may not apply to all missions. Further validation with other satellites is needed because hardware and operational environments vary. Second, this study focused on detection, not root-cause diagnosis or predictive maintenance. To reach a complete FDIR capability, future research must use expert knowledge to understand the causes and provide early warnings before faults happen. Third, the lack of labeled events limited our quantitative evaluation. To accurately measure detection and false-alarm rates, more validation cases are needed, which requires continuous effort to collect labeled data.
Despite these limits, this study is meaningful because it systematically tested the potential of intelligent fault detection using domestic satellite data. AI-based anomaly detection will be an essential tool in future environments where many satellites are operated at the same time. Based on this work, we suggest several future directions. First, the research should expand to next-generation satellites to test if the model works across different platforms. Second, semi-supervised learning could be used to improve precision by using the small number of fault cases found during operations. Third, it is important to develop explainable AI (XAI) and visualization dashboards so that operators can understand and act on the results. This will lead to intelligent systems that can recommend specific response actions when anomalies are found. Fourth, the approach can move from ground centers to onboard AI for real-time detection on the spacecraft computer. Using lightweight models for immediate response without communication delays will become increasingly important.
The results also have implications for space security. By continuously monitoring multivariate telemetry patterns, the proposed approach can help operators detect not only internal faults but also abnormal operational signatures that may result from external interference, cyber-related events, or degraded communication links. Therefore, domestic AI-based anomaly detection capability contributes to the protection, resilience, and autonomous operation of national space assets.
In summary, using AI and data mining for satellite fault prediction is a core technology for the growing demands in satellite operations. This work establishes its foundational basis. Continued research combining data, expert knowledge, and advanced algorithms will enable safer and more efficient space missions through autonomous health-monitoring systems.
